Data Visualization
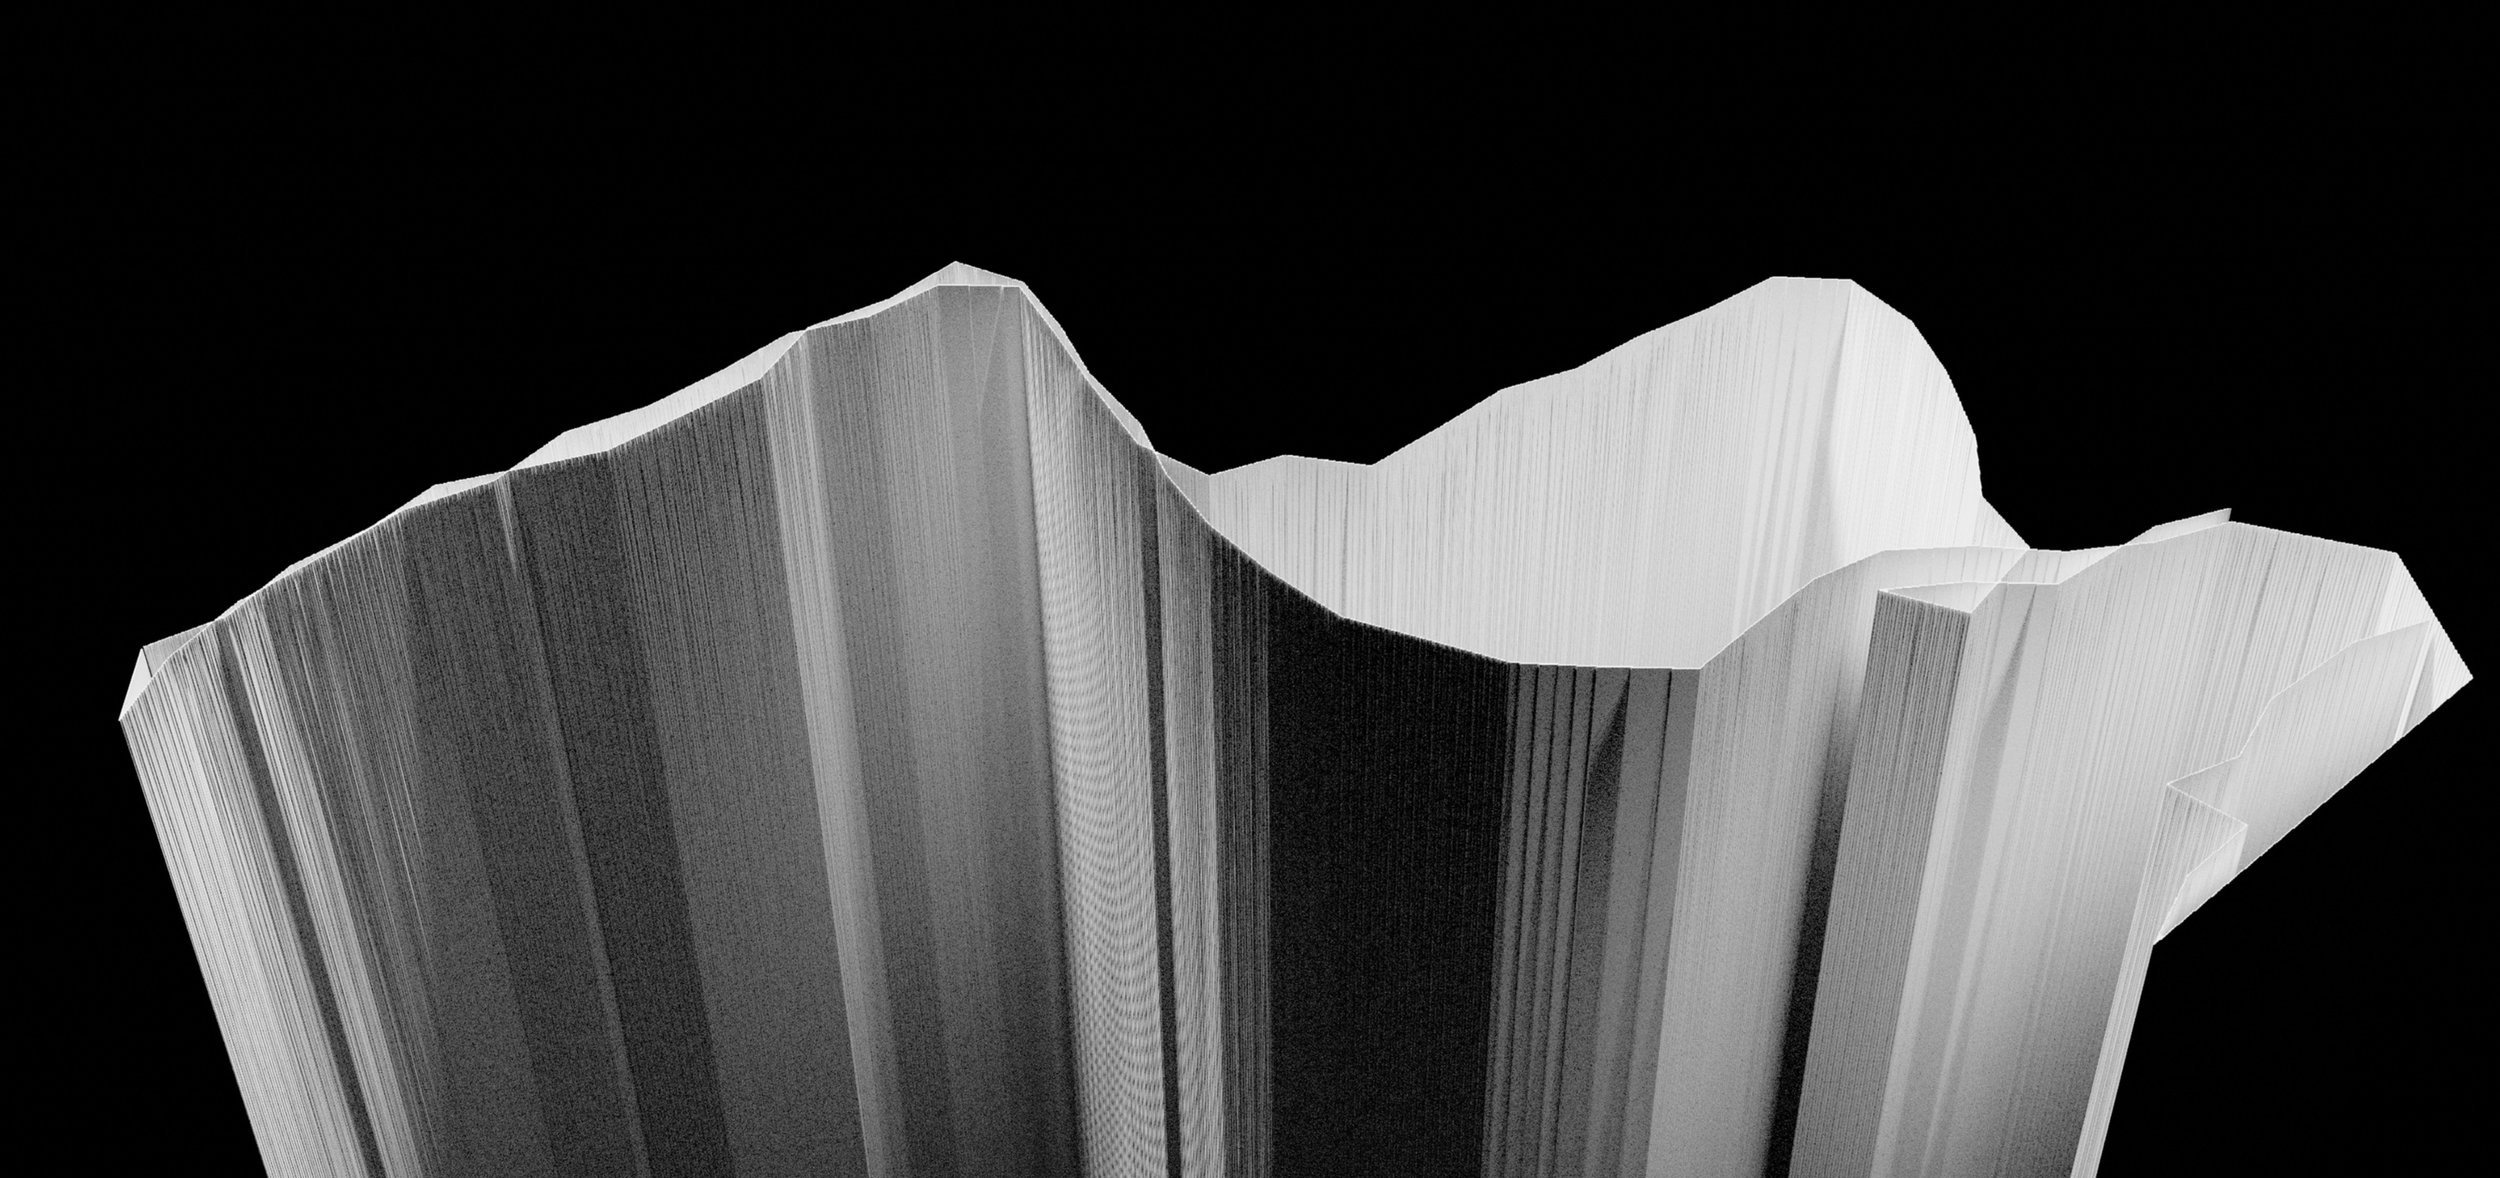
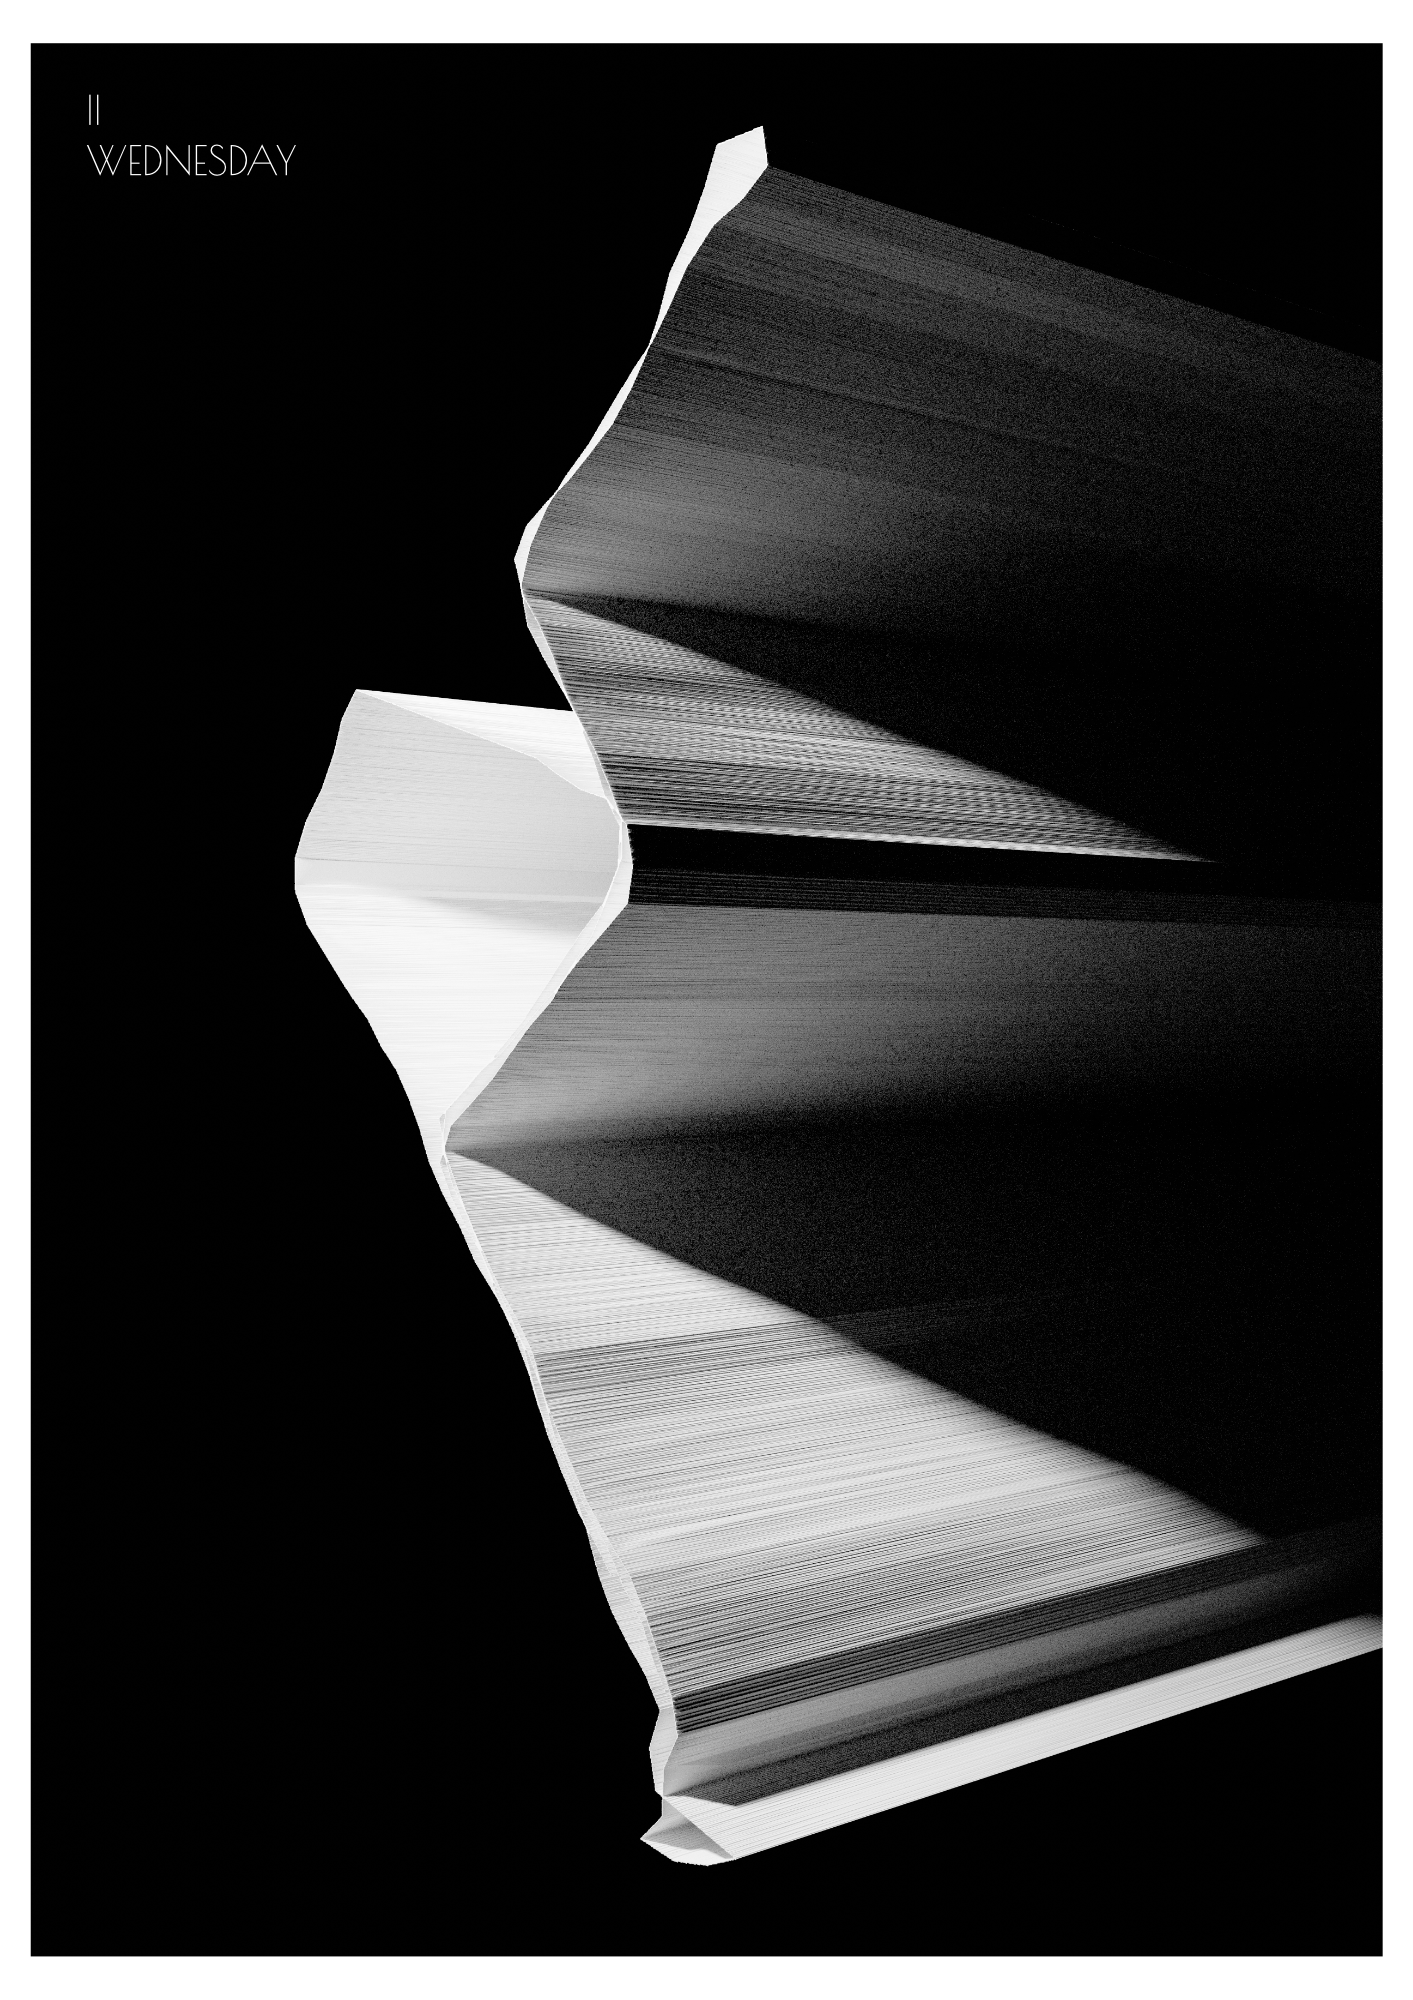
The following project is a creative rendition of Geo-Data that was collected by a team of students. The idea was to record every movement over the course of a week and visualize that data within an interactive map. In addition to that a three dimensional visualization of the routes was created.


